How to Read
Linux Top Command Output:
|
Result Row #1:
|
up
time from last reboot, currently logged in users and cpu load on server
|
uptime
|
|
Result Row #2
|
process running on server and there state.
|
|
|
Result Row #3:
|
cpu utilization status on server
|
|
|
Result Row #4:
|
shows
the memory utilization on server,
|
free
|
|
Result Row #5:
|
Row
4 shows the swap memory utilization
on server
|
free
|
|
Result Row #6:
|
All running process on servers
|
|
Top Command: As
a Linux system administrator, top command is a
frequently used command and our daily tasks we used multiple times this
commands to view resource utilization by processes on server. This command
helps us to find which process is utilizing what resources of system.
Using this article, I am trying to write to how to use and
read results of top command.
How to Read
Linux Top Command Output:
When we execute top command on
linux, it shows a lot of results, here i am trying to
show you to how to read it row by row.
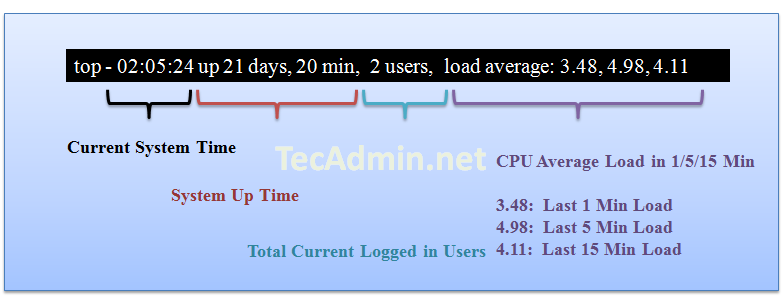
Result Row #1:
Row 1 results shows about server up time from last
reboot, currently logged in users and cpu load on server. The same output you
can find using linux uptime command.

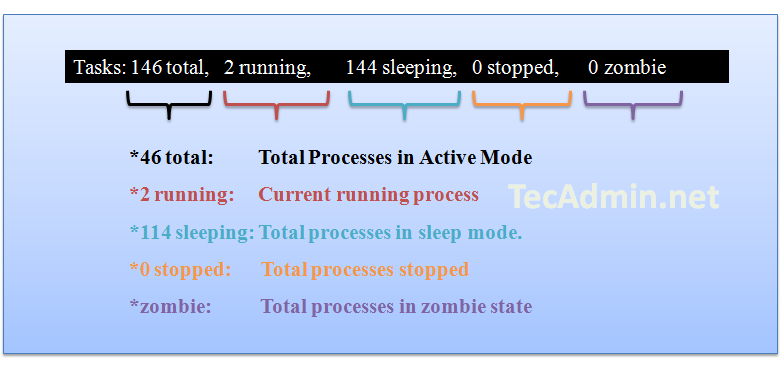
Result Row #2:
Row 2 shows the number
of process running on server and there state.
Zombie process or defunct process is a process that has completed
execution but still has an entry in the process table. This entry is still
needed to allow the parent process to read its child’s exit status.
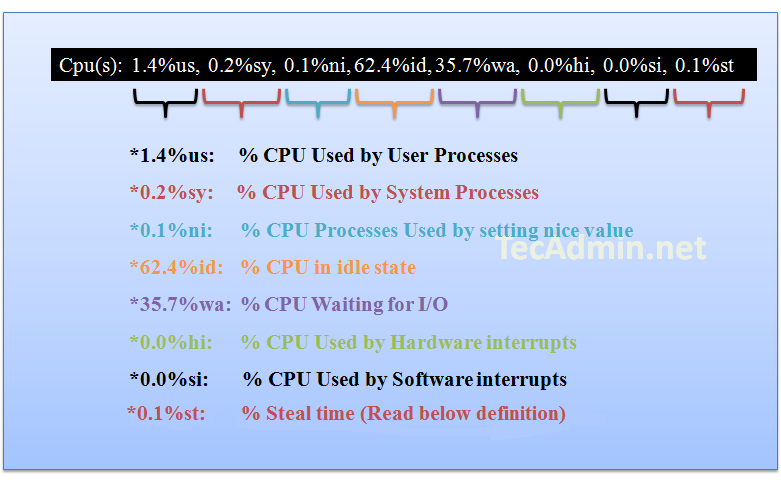
Result Row #3:
Row three shows the cpu utilization status on server, you can
find here how much cpu is free and how much is
utilizing by system.
Definition from access.redhat.com:
Steal time is the time that a virtual CPU waits for a real CPU while the hypervisor is servicing another virtual processor.
Steal time is the time that a virtual CPU waits for a real CPU while the hypervisor is servicing another virtual processor.
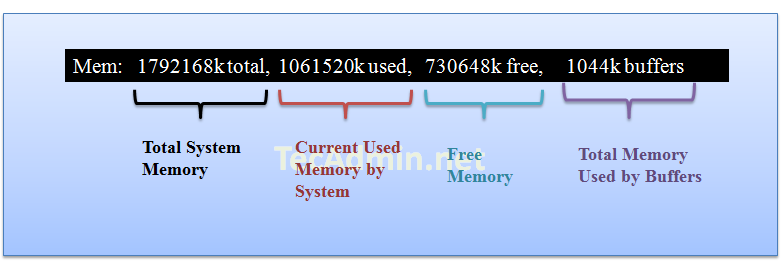
Result Row #4:
Row 4 shows the memory utilization on server, you can find
here how much memory is used, the sameresults you can find
using free command.
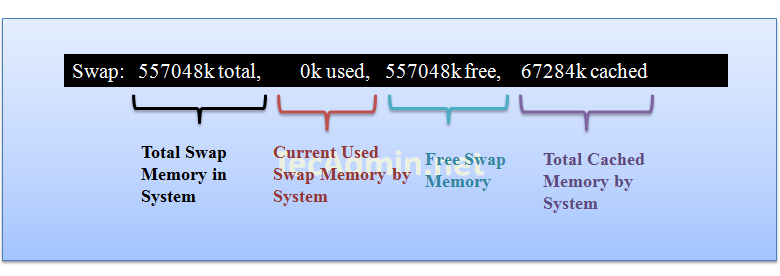
Result Row #5:
Row 4 shows the swap memory utilization on server, you can find
here how much swap is being used, the same results you can
find using free command.
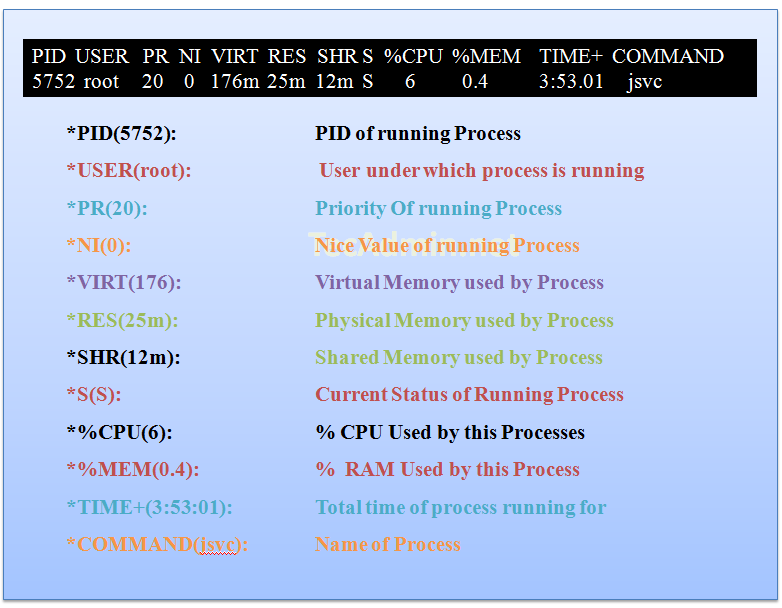
Result Row #6 ( Running Processes ):In this steps you will see all running process
on servers and there additional details about them like below.
If you want to sort
output on basis of any fields, you can use following key combinations.
Press "SHIFT + F" and Select your choice below and press
ENTER.
A ( PID = Process Id )
b (
PPID = Parent Process Pid )
d (
UID= User Id )
e (
USER = User Name )
f (
GROUP = Group Name )
g (
TTY= Controlling Tty )
h (
PR = Priority )
i (
NI = Nice value )
j (
P = Last used cpu (SMP) )
k (
%CPU = CPU usage )
l (
TIME = CPU Time )
n (
%MEM = Memory usage (RES) )
o (
VIRT = Virtual Image (kb) )
p (
SWAP = Swapped size (kb) )
q (
RES= Resident size (kb) )
r (
CODE = Code size (kb) )
s (
DATA = Data+Stack size (kb) )
t (
SHR= Shared Mem size (kb) )
w (
S = Process Status )
x (
COMMAND= Command name/line )
Thank you for
reading this port, If this port is helpful for you, please do not forgot to
share it. If you have any suggestions please put your comments below.
No comments:
Post a Comment